Why invest

Our successful business model provides a solid platform for growth. We combine a diverse portfolio with excellent financial discipline to deliver outstanding value for shareholders.

A solid platform with unique business model 

  • Leading market positions – 7th largest in the US1 and 2nd largest in MENA2 
  • Expanding manufacturing footprint  - 29 plants across our markets, with additional facilities being established
  • Global player with local expertise
  • Trusted partner known for our commitment to quality and reliability of supply
  • Agile supply chain, flexible manufacturing and leading technical capabilities
Highlights
$ 3,156 m Group core revenue
$ 719 m Group core operating profit
26.1 % Core EBITDA margin

An increasingly diverse portfolio and pipeline

  • A broad portfolio that is tailored to local market needs
  • Targeting increase in R&D spend to 6–7% of Group revenue to ensure the consistent development of new products
  • Growing presence in specialty, complex and higher-value products, which offer less competition and higher margins
  • Strong momentum in new product launches across our markets
  • Enhancing our pipeline by adding innovative products through value-creating partnerships
  • Adding to the strength of our base business through strategic acquisitions
Highlights
4.5 % 2024 R&D spend as % of revenue
132 launches across our markets in 2024
300 + products in pipeline

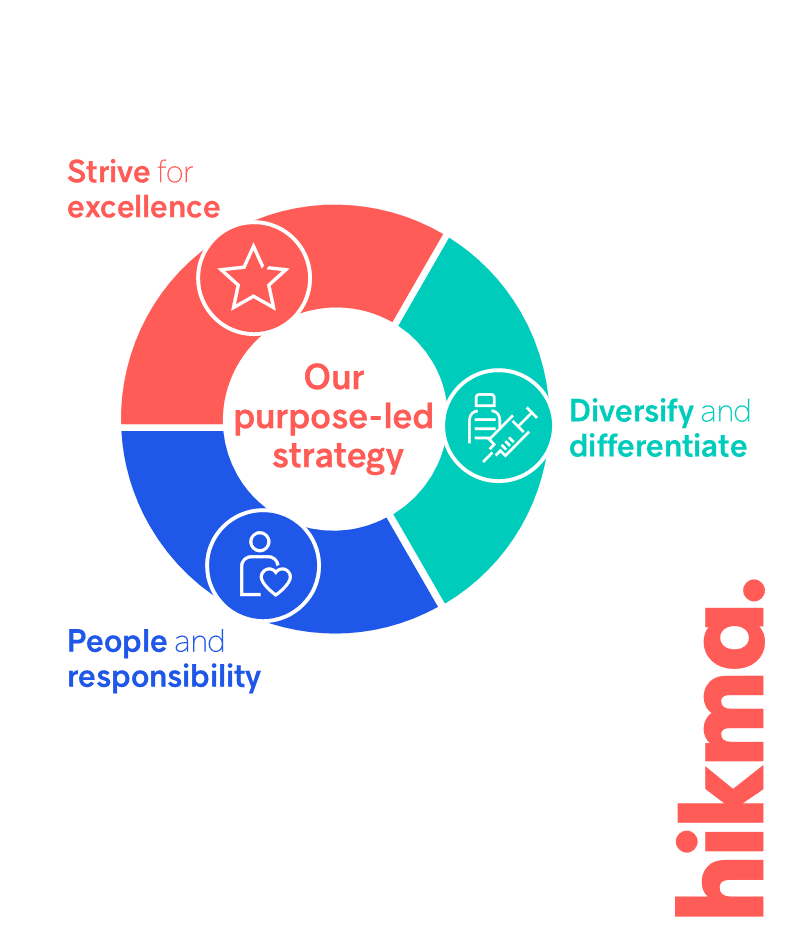
Strategic execution driven by our three pillars


We aim to deliver consistent and profitable growth by putting better health within reach every day, creating high-quality medicines and making them accessible for patients around the world. Our three strategic pillars are: to strive for excellence; to diversify and differentiate our pipeline; and to empower people and act responsibly.

A proven track record of delivery for shareholders

  • Group revenue compound annual growth rate (CAGR) of 7% and core EBIT CAGR of 7% since 2019
  • Strong cash generation with $564 million operating cash flow in 2024
  • Strong balance sheet that provides financial flexibility to support future growth, with low leverage of 1.4x net debt to EBITDA
  • High returns, with 16.9% return on average invested capital
Highlights
7 % Group 5-year revenue CAGR
7 % Group 5-year core EBIT CAGR
16.9 % Return on average invested capital

All figures for year ending 31 December 2024. 

Latest news

All news stories

Supporting communities globally: Highlights from our 2025 Global Volunteer Campaign

Story, Responsibility 03 July 2025

Meet Farah Alasali, Senior Officer in our Social Responsibility team based in Jordan. Hear what she has to say about lif...

Story, Life at Hikma 02 July 2025
New

Hikma receives FDA approval for TYZAVANTM (Vancomycin Injection, USP) in the US

Press Release, Product 02 July 2025
New

Hikma publishes its 2024 Sustainability Report reinforcing commitment to global access to medicines

Press Release, Corporate 30 June 2025

Hikma R&D – Innovating analytical research: meet Samuel Cook

Story, Life at Hikma 30 June 2025

Hikma Pharmaceuticals USA announces $1 Billion of new US investment to further expand its domestic manufacturing and dev...

Press Release, Corporate 28 June 2025
New

Inspiring women of Hikma - Meet Judy Bock, Associate Director, Quality Assurance

Story, Leadership 27 June 2025
New

Hikma launches Methylene Blue Injection, USP in the US

Press Release, Product 25 June 2025

Meet Nika Beck and learn more about how she champions quality

Story, Responsibility 23 June 2025

Meet Osama Alrifai and learn more about how he champions quality

Story, Responsibility 23 June 2025
Related content

Recent results

1. IQVIA MAT December 2024, includes all generic injectable and non-injectables
2.  Based on internal analysis by using data from the following source: IQVIA MIDAS® Monthly Value Sales data for Algeria, Egypt, Jordan, Kuwait, Lebanon, Morocco, Saudi Arabia, Tunisia and UAE, for the period: calendar year 2024, reflecting estimates of real-world activity. Copyright IQVIA. All rights reserved.